This page describes comparisons between the UKMO C-130 aircraft and the Chilbolton radar during the CWVC flight on 30 March 1999. In particular we examine the association of the radar parameter ZDR with the in situ measurements of LWC. Three ascents were performed, the second of which was the most successful. Damian Wilson has run the model for this case; his findings are discussed here.
The original quicklooks of (nearly) all the radar scans can be found here. Note that the aircraft tracks shown superimposed involved no advection in space because of timing differences.
In this page the same data is used to get an idea of the three-dimensional structure of the features observed and how the aircraft measurements relate to them, but much more care is taken to ensure the coincidence of the measurements.
Animation of the ZDR=2 dB isosurface
The first ascent took place between 11:34 and 12:07 (Runs 8-14). At around 11:35 and 11:57 (Rasters 133 and 146) the radar performed volume scans consisting of 6 horizontal scans (PPIs) at elevations of 0.5, 1.5, 2.5, 3.5, 4.5 and 5.5 degrees. In hindsight, it would have been preferable to use intervals of 0.5 degrees and to scan to a much higher elevation (particularly later when the ZDR features were much closer to the radar). Nonetheless, it has been possible to reconstruct a three-dimensional map of the radar parameters Z and ZDR.
To see an animation of the ZDR=2 dB isosurface at 11:34 (red) and 11:56 (green), click here. (Warning: this file is 600 KB in size. The resemblance to what you might get if you sneeze in zero gravity is undeniable....)
High ZDR is an indicator of the presence of pristine columns or plates. At 11:34 in this animation we see a band of high ZDR at an altitude of 4 km around 60 km from Chilbolton. It extended around 10 km in the direction parallel to the mean wind (which was south-westerly) and at least 30 km in the perpendicular direction. Vertical scans (RHIs) through the feature show the same thing: see Rasters 129, 130, 131, 132, 134. This may have been associated with a layer of supercooled water, as in the CLARE'98 flight of 20 October 1998, but in this flight no lidar was available to detect such a feature. Extending beneath the layer was an elongated tendril that reached down to the melting layer at just below 2 km (as can be seen in the RHIs). By 11:56 the high ZDR region had been advected around 30 km to the north-east, at which time the slanted tendril of ZDR was even more pronounced. Unfortunately the radar did not scan high enough in the volume scan to fully sample the layer at 4 km, although a cross-section through it can be clearly seen in the top-most scan of the sequence. For the vertical structure, see Raster 142, where we can see a strong enhancement of the ZDR in the melting layer.
Aircraft location relative to the high ZDR
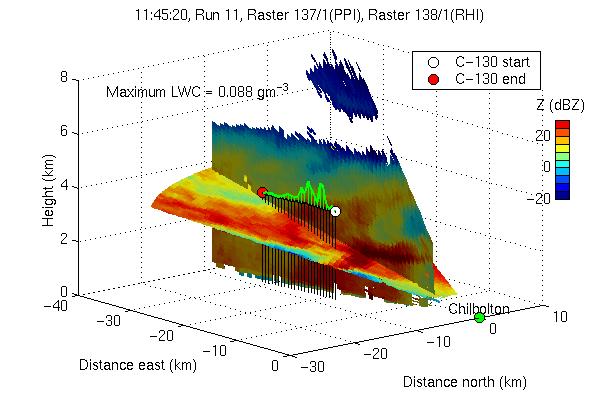
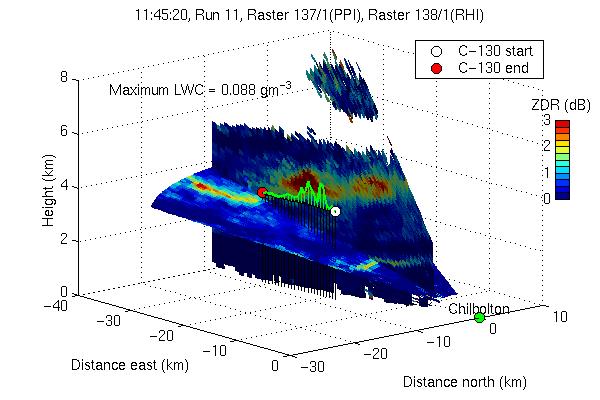
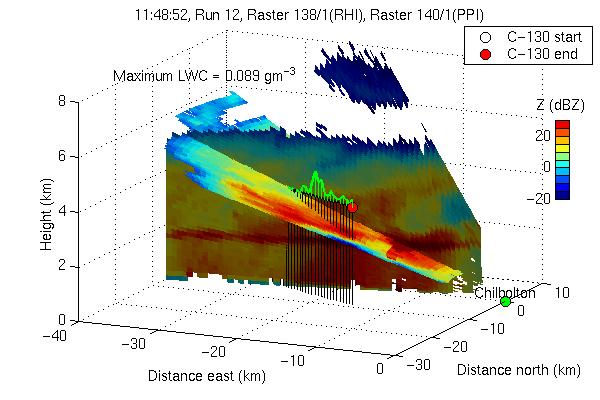
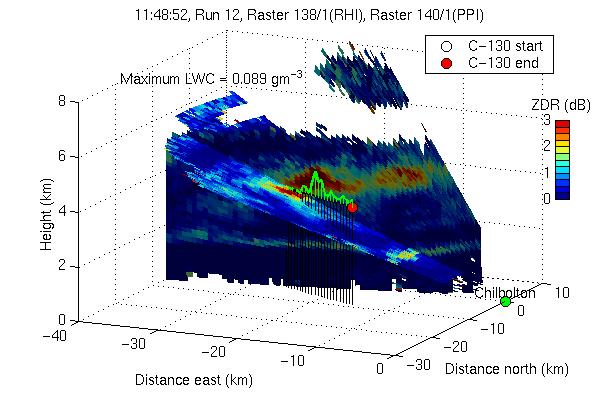
The aircraft ascent was performed at a range of 10-40 km from Chilbolton, so it unfortunately did not sample this main region of high ZDR. The highest liquid water content measured by the aircraft during this ascent was 0.09 g m-3, in Runs 11 and 12 (at an altitude of around 3.5 km). The liquid water appears to have been associated with a small region of high ZDR just a few hundred metres above the aircraft; see Raster 138.
To compare the aircraft information with the radar for a given leg, 3D images have been created showing the aircraft trajectory and the nearest RHI and PPI in time. Since the scans were often taken a few minutes before or after the run, the radar data has been advected in the x-y plane using the mean wind as measured by the aircraft during the run. It is then clear from the image whether the aircraft and radar data are close enough for a comparison to be meaningful.
The 3D position of the aircraft relative to the radar information for these two runs is shown here: The green line shows the liquid water content measured by the aircraft during the run. Note that the RHI in each of these images is the same one - raster 138.
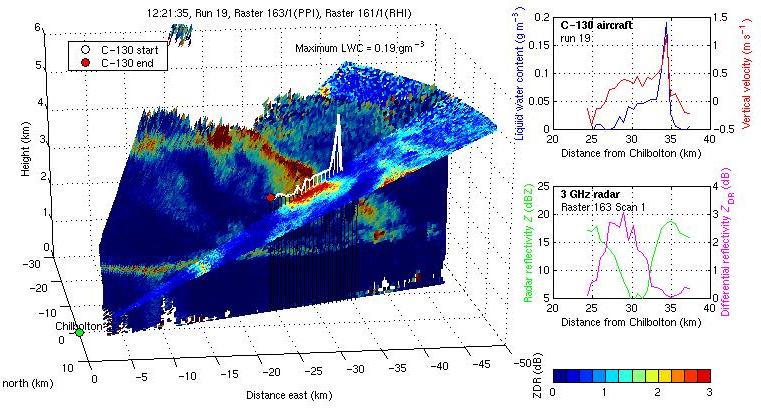
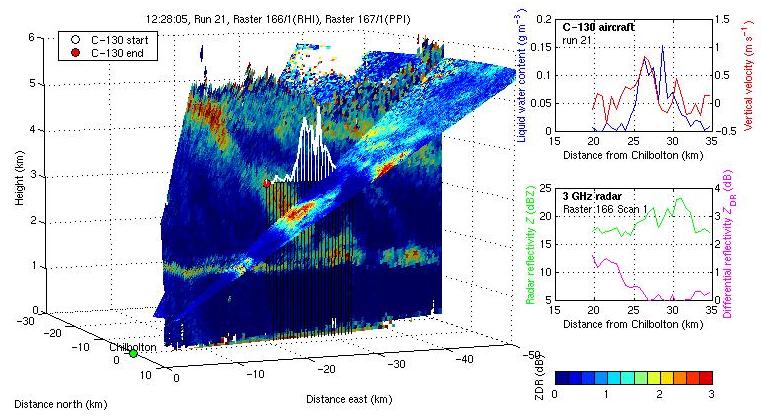
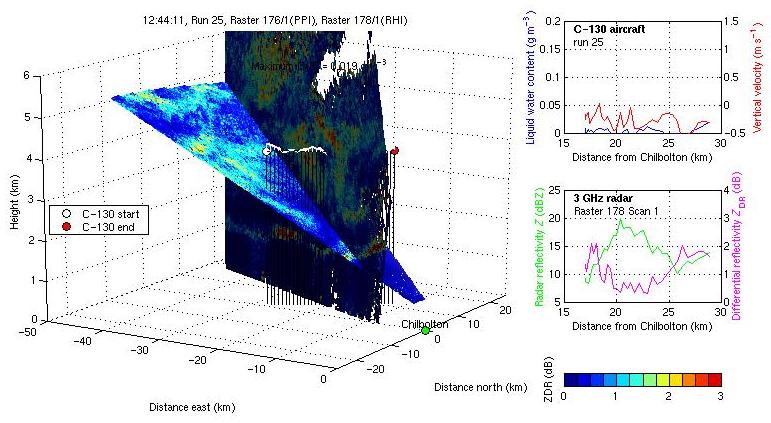
This was a much more successful ascent - higher liquid water contents (up to 0.19 g m-3 in Run 19) were measured, and the aircraft sampled the centre of a distinct plume/tendril (?) of high ZDR. For each run a 3D plot has been produced showing the position of the aircraft relative to the radar data and showing the interpolated value of ZDR along the track of the aircraft for comparison with LWC.
Click here to see the horizontal and vertical velocities measured during this ascent.
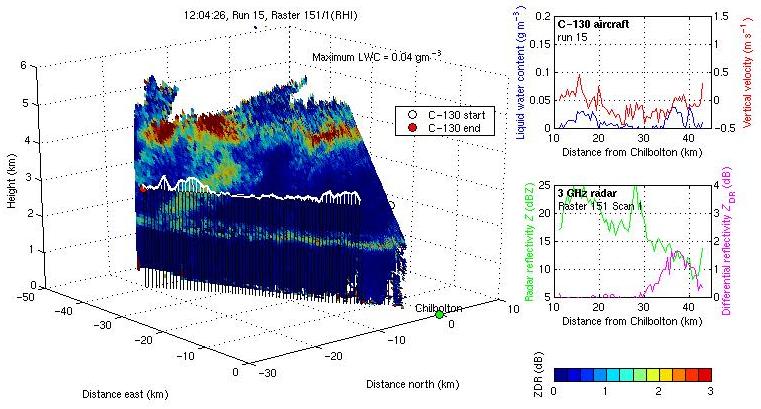
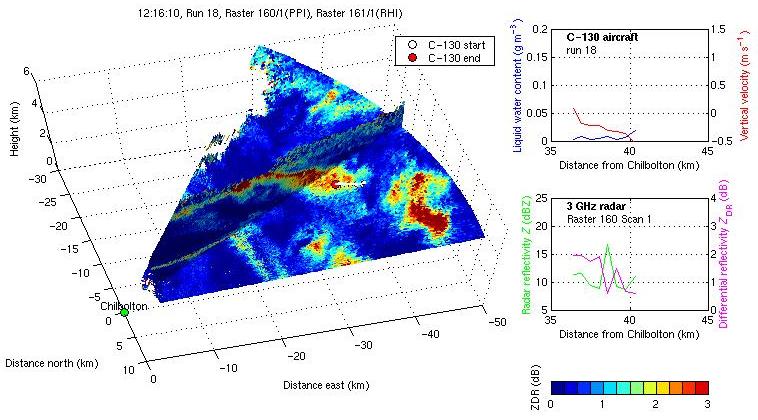
Liquid water up to 0.04 g m-3 detected by the aircraft on a search run. Close to the radar this was unusually associated with very low ZDR, but the second peak at 40 km range was associated with values of around 1.6 dB. No PPI available.
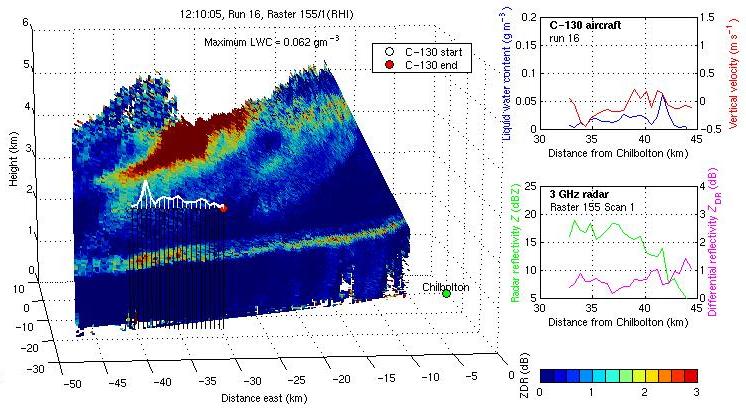
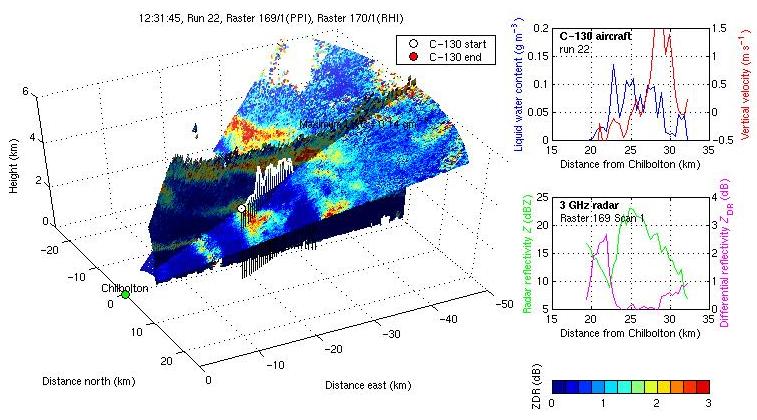
Under a region of very high ZDR - maximum value at cloud top around 7 dB. The aircraft measured LWC up to 0.05 g m-3 at the tail of this region. No PPI available.
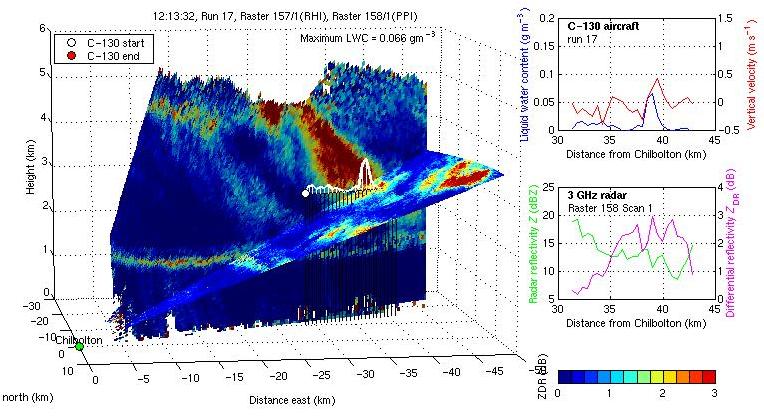
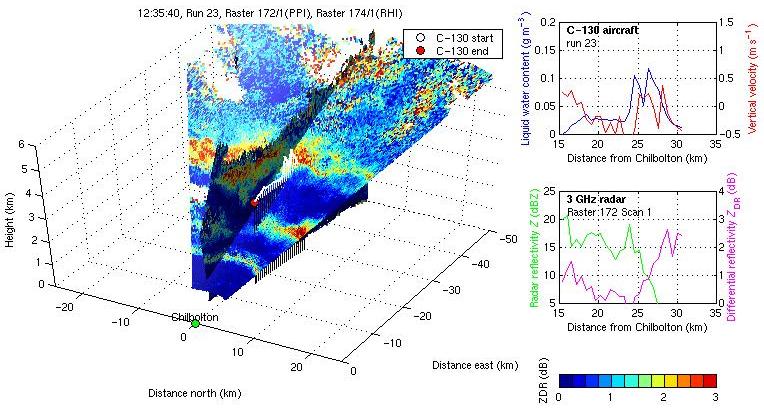
Aircraft flies right through the ZDR plume where the peak LWC is measured.Run abandoned after 4 km.
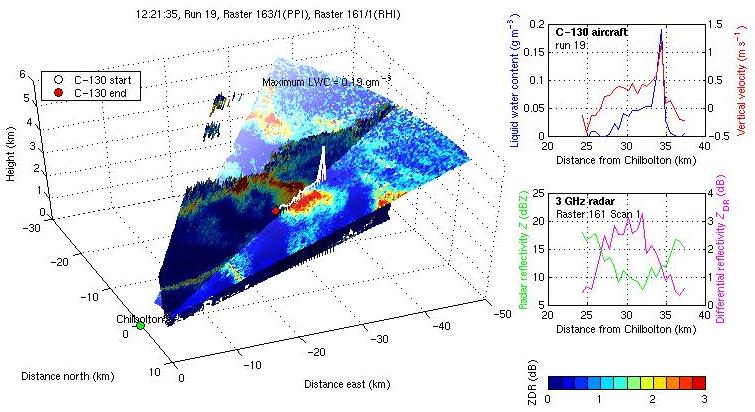
Run 19 (interpolation from PPI) Run 19 (interpolation from RHI)
Again the aircraft penetrates the centre of the ZDR plume and measures the highest LWC.
Nice match between ZDR and LWC, but note that the radar data was taken 5 minutes before so had to be advected several kilometres in which time the field could have evolved appreciably.
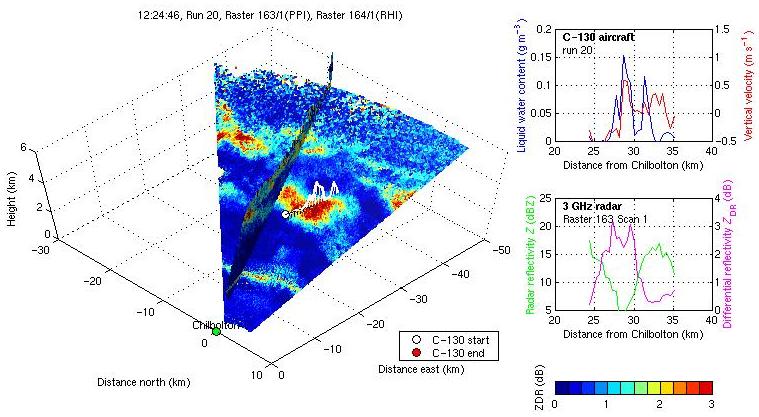
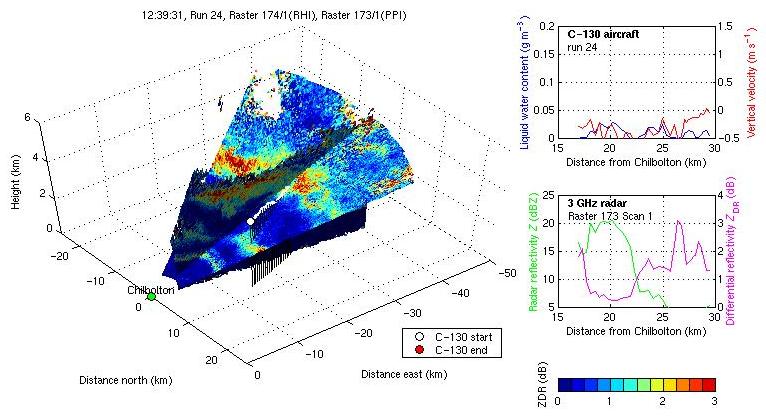
Sizable LWCs measured, but this time they are significantly above the main ZDR region. Explanation: it takes a finite time for liquid water to affect the growth of crystals so they tend to be beneath the LWC peak. As RHIs show the plume to be more slanted at higher altitudes, this is where the effect is more detectable.
The main body of the high ZDR plume is somewhat to the north-east of the aircraft track, but another region of fairly high ZDR can be seen near cloud top. which the aircraft is a short distance beneath. One could still draw the same conclusions as in the previous leg.
Significant liquid water being measured but the plume is well to the north so this is probably associated with the high ZDR near cloud top.
Liquid water content now much less. No close radar data for a good comparison.
Low LWC, and no distinct features in ZDR.
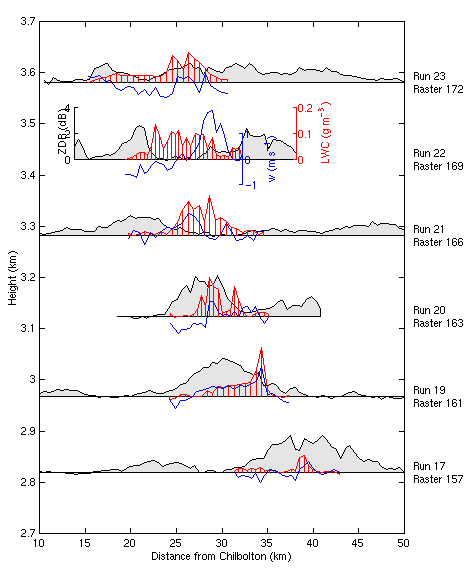
Combining the runs from Ascent 2
The following figure shows LWC and vertical velocity from the 6 main runs of Ascent 2 (those in which a coherent plume was being sampled), together with ZDR from the nearest scan after advection. Two of these scans were PPIs, so their full horizontal extent is not shown because the height of the scan obviously varies considerably with range. The slant of the plume is partially artificial since it is obviously advected a significant distance in the time it took the aircraft to sample both the bottom and the top.
I don't know how reliable the absolute values of vertical velocity are.
This ascent has not been studied in detail. A very coherent plume of ZDR was seen (see Rasters 196, 197, 198, 200, 201, 202, 204, 205, 206, 208 and 206), but it was completely missed by the aircraft, and because of the azimuth of the aircraft was not seen in any of the RHIs.