


Last update
13 May 2004

This page is maintained by
Mark Fielding
All content Copyright © The University of Reading unless otherwise stated.
Radar observations of a cold front on 20 October 2000
Most of the rain that falls in the UK is associated with fronts, and the high resolution of the Chilbolton weather radar enables the formation and development of precipitation in the atmosphere to be mapped out.
The animation below depicts the radar echo intensity over a 1 hr 15 min period during an approaching cold front. The radar is looking to the west. The echos above 2 km are from slowly falling ice particles. At 2 km they melt and the radar records an enhanced return in a thin layer, known as the bright band. Below this height the resulting rain drops fall out much more rapidly.
A noticeable feature of this case is the apparent rapid growth of ice at around 4 km, where the temperature was -12°C. Aircraft and baloon measurements from this indicated that this was due to the additional presence here of a thin layer of supercooled liquid water, which promotes the growth of ice crystals, and therefore can lead to more intense rainfall at the surface.
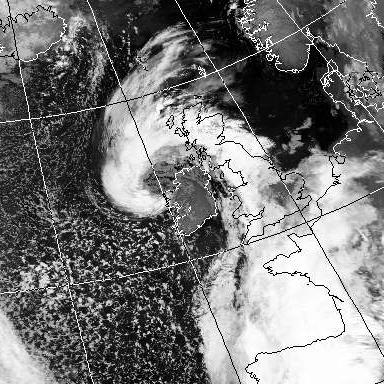
The corresponding images from satellite and from the Met Office radar network are shown below. The satellite image shows the cold ice cloud associated with the front wrapping around the centre of the low pressure system. The Met Office radar animation shows the surface rainfall beneath the ice cloud in the form of two narrow rainbands.
| Infrared satellite image at 7:00 | Met Office radar network 9:00-15:00 |
 |
 |
More images and
information from this and similar case studies.
See thunderstorm case study.