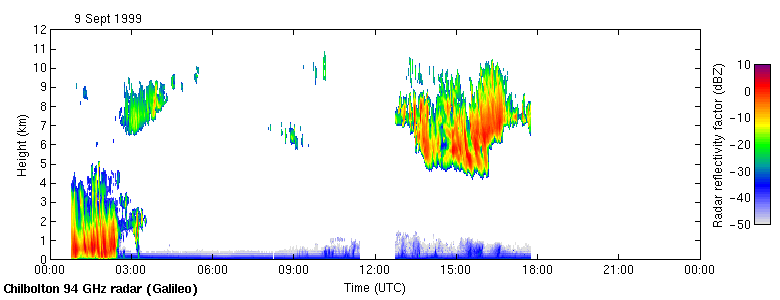
Some sample output from chilplot is shown below, illustrating the processing that is possible. The data are at 94 GHz, and were recorded on 9 Sept 1999 in the file 9252c94d.dat. The command
chilplot -all 9252c94d.dat -oscillator -noisegates 25 \
   -noisefactor 3.0 -doubleclean -Zcal +23 -correctrange \
   -minelev 85 -reject 10 30 -maxfields 1 -averays 60 -xfs unix/:-1
writes 19990909_94_Zh.png to the current directory:

chil2a -all 9252c94d.dat -oscillator -noisegates 25 \
   -noisefactor 3.0 -doubleclean -Zcal +23 -correctrange \
   -minelev 85 -reject 10 30 -maxfields 1 -averays 60
writes an ASCII file called 19990909_94.dat in the current directory. Here is a zipped version: http://www.met.rdg.ac.uk/radar/software/19990909_94.dat.gz. The command
chil2nc -all 9252c94d.dat -oscillator -noisegates 25 \
   -noisefactor 3.0 -doubleclean -Zcal +23 -correctrange \
   -minelev 85 -reject 10 30 -maxfields 1 -averays 60
writes a netCDF file called 19990909_94.nc in the current directory. Here is a zipped version: http://www.met.rdg.ac.uk/radar/software/19990909_94.nc.gz.