Run 3 ('4d'-Var)
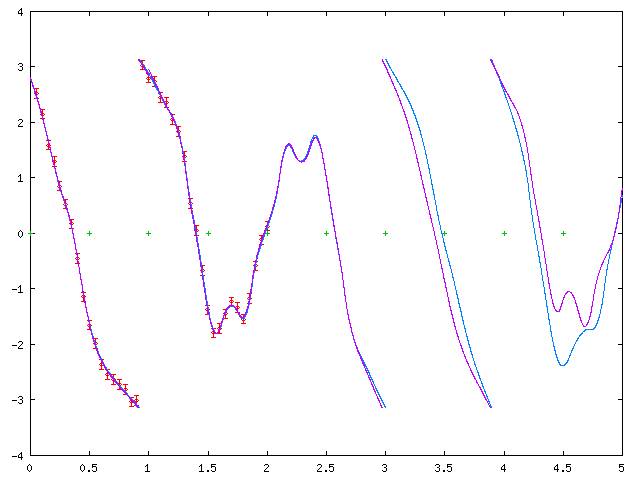
2 sec of observations (in 5 sec run). Observations are of both angles, but not their speeds.Graph A: Primary angle of double pendulum vs time
Key:Green points mark the assimilation cycle boundaries.
Blue is the exact solution.
Red are the observations used.
Magenta is the assimilated solution.
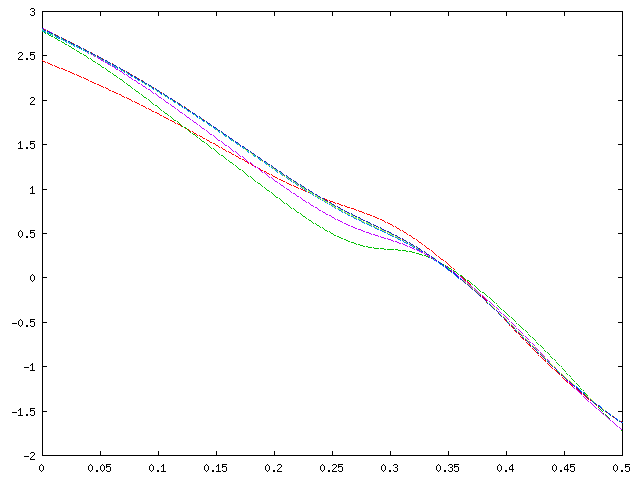
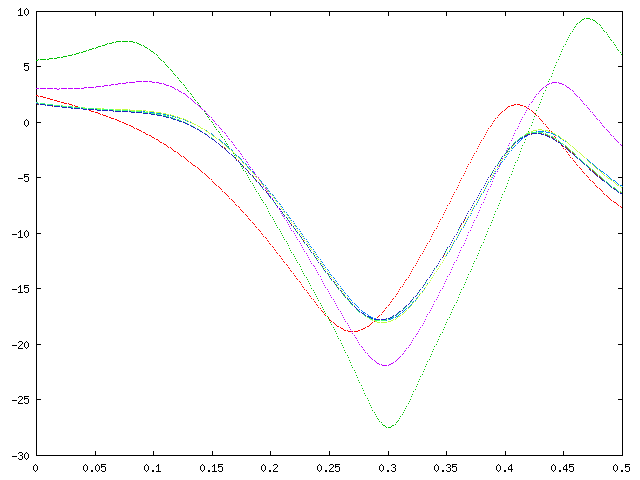
Graph B: Convergence of the primary angle (vs time) for the first assimilation cycle
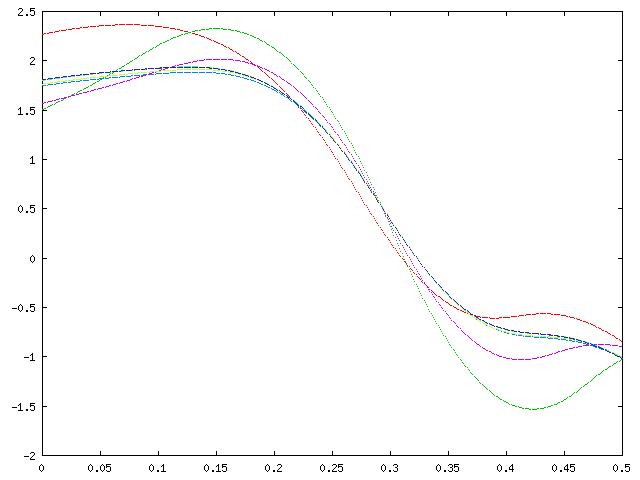
Graph C: Convergence of the secondary angle (vs time) for the first assimilation cycle
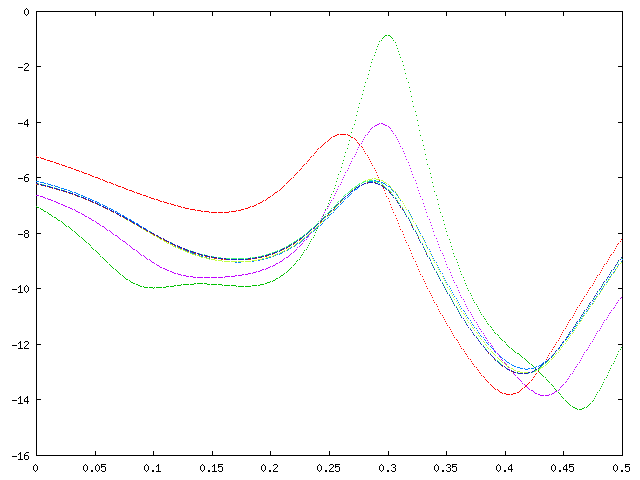
Graph D: Convergence of the rate of change of the primary angle (vs time) for the first assimilation cycle
Graph E: Convergence of the rate of change of the secondary angle (vs time) for the first assimilation cycle
RETURN TO INDEX PAGE