Plot 1 shows your chosen plot, while plot 2 compares this with the equivalent composite plot, plot 3 shows the location and plot 4 shows the satellite image.
Storm 3 had its peak vorticity on 850hPa at 12:00 on 8/1/1990.
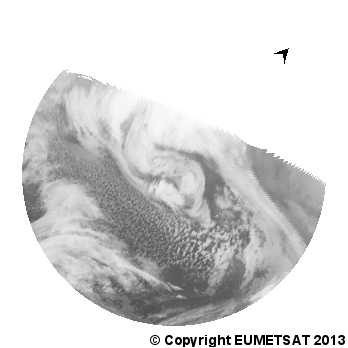
The storms are rotated so that they all move to the right, and so the North arrow,  , shows which direction is North.


Sorry, chart is unavailable for this storm at this time. Charts are unavailable for the eastern and very northern Atlantic and before 1995.