This figure shows composites of lower- and upper-level fields throughout the developing stage of the composite cyclone lifecycle have been combined to illustrate the relative development of the cyclone at upper- and lower-levels. These figures are comparable to the conceptual models described in Semple (2003) and Browning (1990) etc.
In the initial stage of development (figure a), a weak low-level temperature wave is seen to form downstream of an upper-level shortwave trough. As the surface cyclone develops (figures b and c) cold air advection to the west of the surface cyclone reduces the thickness of the atmospheric layer between 1000 hPa and 500hPa and deepens the upper-level trough. Conversely, warm air advection to the east of the surface cyclone increases the 1000-500 hPa thickness and intensifies the upper-level ridge. Thus differential temperature advection to the west and east of the surface cyclone amplifies the upper-level wave.
As the upper-level wave amplifies positive differential vorticity advection downstream of the upper-level trough forces ascent above the surface cyclone. The resulting lower-tropospheric vortex stretching intensifies the surface cyclone. Increased low-level wind speeds lead to an amplification of the low-level temperature wave and hence stronger low-level temperature advection which in turn amplifies the upper-level wave. Therefore a positive feedback between the processes occurring at upper and lower-levels occurs.
As the cyclone develops the upper-level low-pressure region moves towards the surface low. In the mature stage the upper-level low is located directly above the surface low producing a vertically stacked cold-core system. The alignment of the surface and upper-level cyclones means that there is no longer a positive feedback effect between the processes occurring at upper and lower-levels and the cyclone decays (not shown).
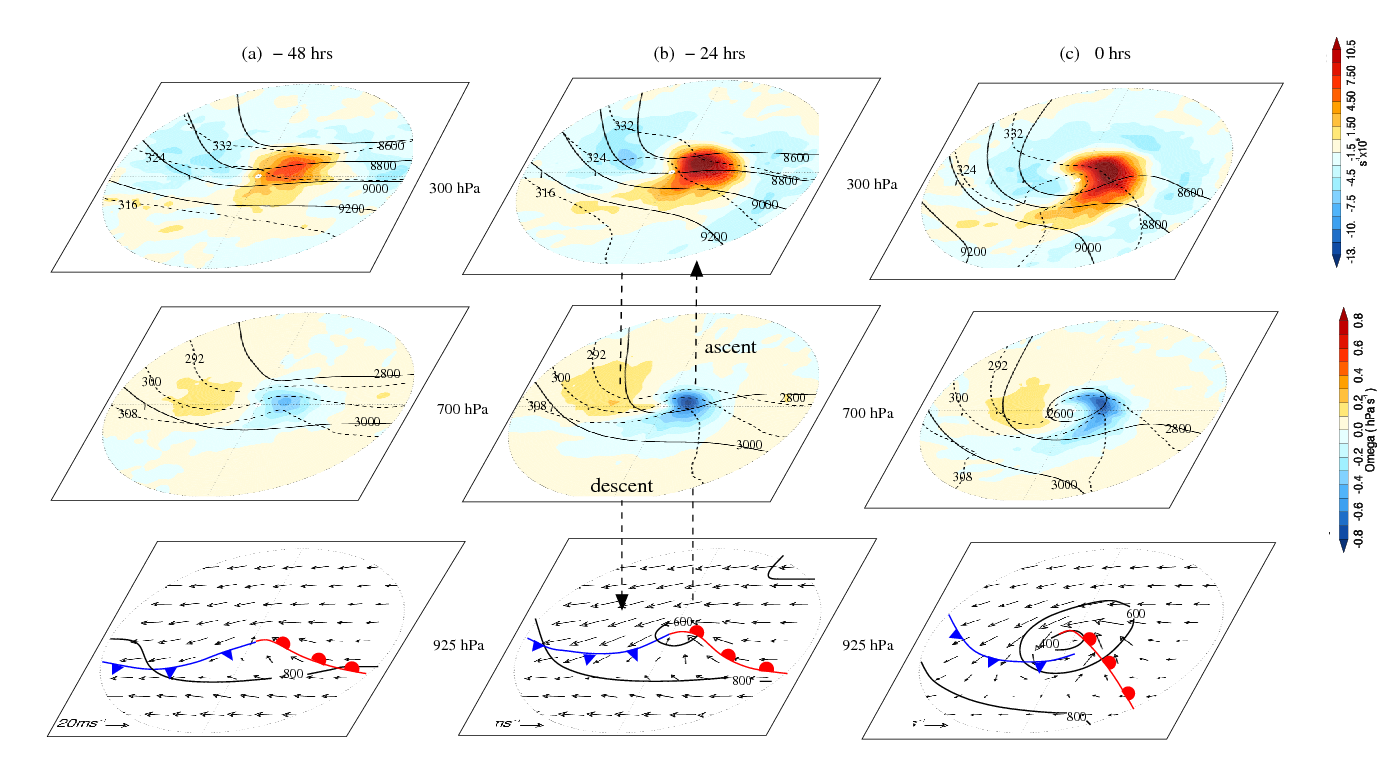
Horizontal composites at (a) 48 and (b) 24 hours before the time of maximum intensity, (c) at the time of maximum intensity. Bottom row: 925 hPa geopotential height (solid, at 400, 600 and 800m); system relative wind vectors and frontal positions. Middle row: 700 hPa geopotential height (solid, at 2800 and 3000 m); θe (dashed, at 292, 300 and 308 K) and vertical velocity (filled). Top row: 300 hPa geopotential height (solid, at 8600, 8800, 9000 and 9200 m); θe (dashed, at 316, 324 and 332 K) and divergence (filled).