This figure shows the main airflows, namely the warm and cold conveyor belts and dry intrusion are subjectively identified at the time of maximum intensity by analysing system relative flow on isentropic surfaces.
At the time of maximum intensity a region of high cloud cover can be seen wrapping cyclonically around the low pressure center (figure b), associated with the warm conveyor belt (Harrold, 1973). The warm conveyor belt is a warm, moist synoptic scale flow of air which advances polewards ahead of the cold front and then splits into two air flows. One air flow (WCB1) ascends along the axis of the cold front and then turns anticyclonically, broadening the polar front cloud band at upper-levels. The second air flow (WCB2) peels off cyclonically from the warm conveyor belt and ascends to form the upper part of a cloud head which emerges from the polar front cloud band. The cloud head is also enhanced by a flow of air coming from the cold conveyor belt. The cold conveyor belt (Carlson, 1980) is a flow of air characterised by lower temperatures that flows rearwards, relative to the advancing system, ahead of the warm front and ascends to form the lower part of the cloud head (figure a). Also identified is a cloud free dry intrusion (Young et al, 1987) which penetrates into the frontal cloud separating the emerging cloud head from the polar front cloud band to form a comma pattern (figure b). This dry intrusion is caused by a stream of dry air from the lower stratosphere descending through a tropopause fold, into the center of the cyclone. As the cyclone develops further the cloud head wraps around the cyclone center and begins to dissipate (not shown).
Figure (c) shows a vertical composite plot along the warm conveyor belt transect. The θe contours are vertically inclined rising from the warm sector, to the south of the cyclone, northwards over the surface warm front. The region of maximum ascent and highest relative humidity are found close to the cyclone center between the 285 and 300 K θe surfaces. The cold conveyor belt flow is identified behind the surface warm front flowing rearwards relative to the propagation direction of the cyclone.
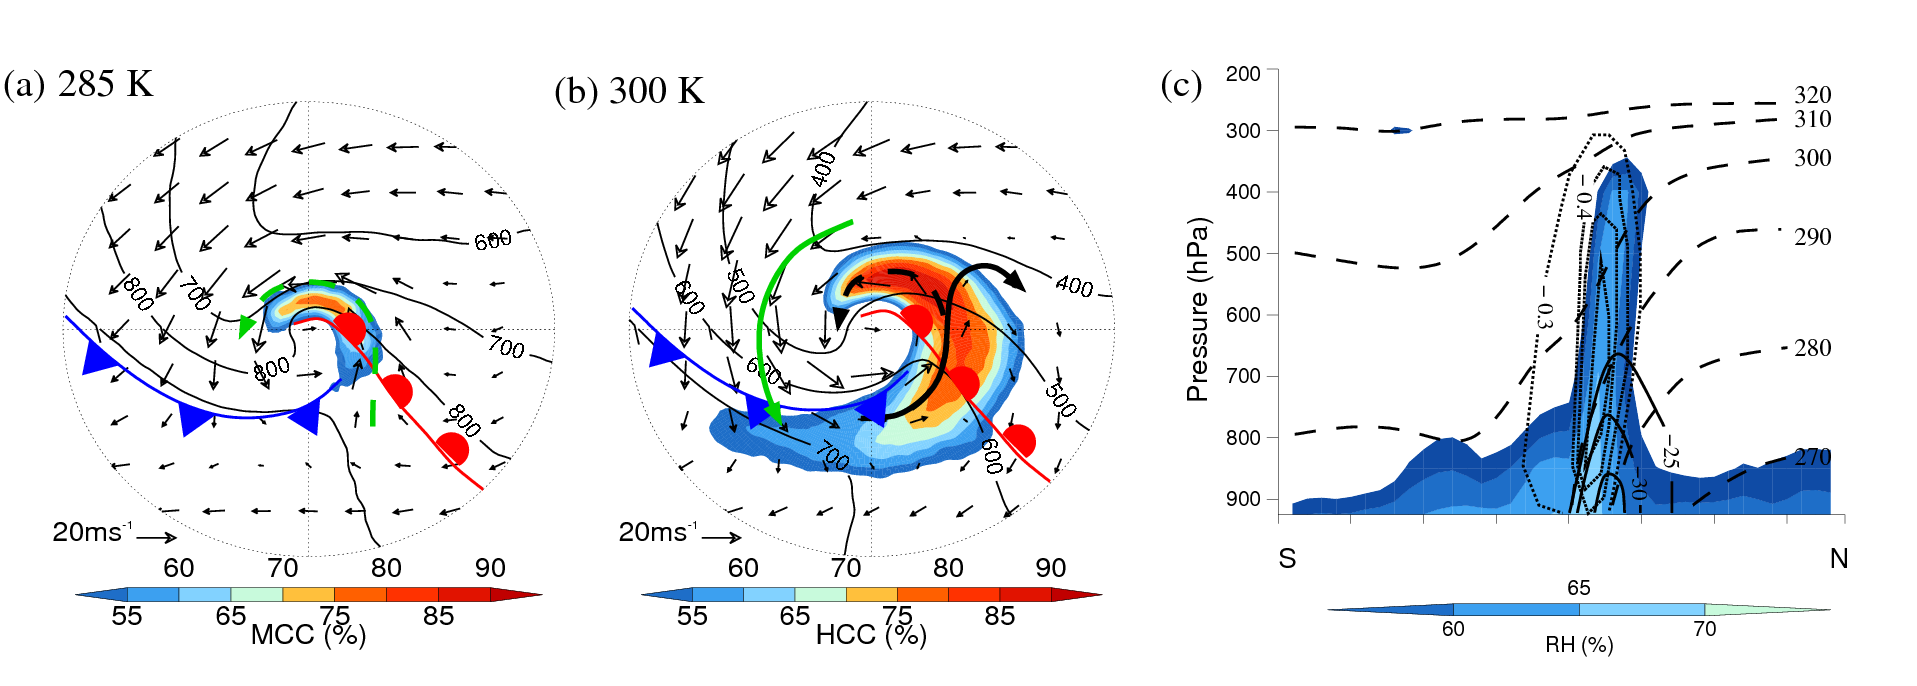
Horizontal composites at the time of maximum intensity. (a) Pressure on 285 K isentropic surface (solid, at 900, 800, 700 and 600 hPa); system relative wind vectors on 285 K isentropic surface; mid-level cloud cover, MCC (filled, >50%); overlaid with surface fronts. Bold green dashed arrow indicates cold conveyor belt flow. (b) Pressure on 300 K isentropic surface (solid, at 700, 600, 500 and 400hPa); system relative wind vectors on 300 K isentropic surface; high-level cloud cover, HCC (filled, >50%); overlaid with surface fronts. Bold arrows indicate warm conveyor belt flows (WCB1, solid black, and WCB2, dashed black) and dry intrusion (solid green). (c) Vertical cross-section along the warm conveyor belt transect. Contours are system relative u-component of the wind (solid, at -35, -30 and -25 ms-1); θe (dashed contours, between 270 and 320 K), vertical velocity (dotted contours, at -0.6, -0.5, -0.4 and -0.3 hPa s-1); relative humidity, RH (filled, >55%).