The figure below shows a composite plot of the upper-level jet stream 24 hours before the time of maximum intensity. A jet streak has formed in the trough of the upper-level geopotential height contours, where the pressure gradient is tight. The developing surface cyclone is located below an area of strong divergence.
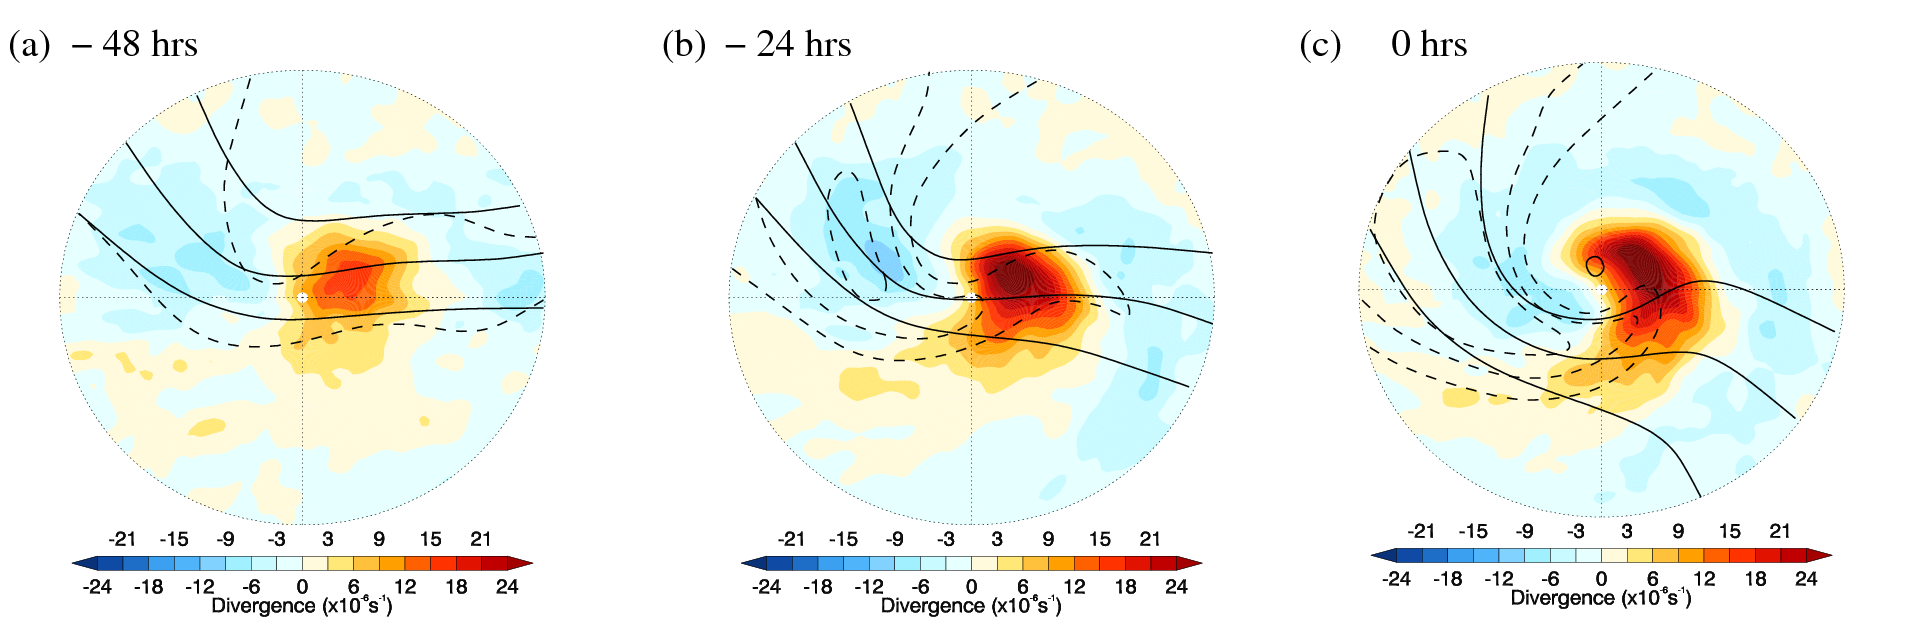
Horizontal composite (a) 48 and (b) 24 hours before the time of maximum intensity, (c) at the time of maximum intensity. 300 hPa geopotential height contours (solid); 300 hPa windspeed (dashed); 300 hPa divergence (filled).