


|
|
Background Information
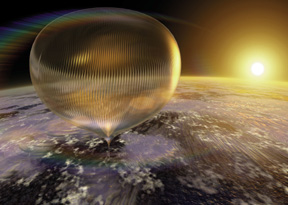
In one final aviation adventure to eclipse all others Andy Elson and
Colin Prescot are preparing to fly the biggest manned balloon in
history - to the Edge of
Space . Using full spacesuits and seated on an open deck the crew
will overtake the world's highest ascent made by two US Navy officers
as part of the American Space programme almost 40 years ago. Press the
forecast buttons for the latest forecast of the path of the
balloon, calculated at the University of Reading, Department of Meteorology.
Here you can see forecasts of the path that the balloon would
follow if launched at various times into the future (indicated on the
blue buttons by the number of hours after the start of the most recent
meteorological forecast). The balloon paths, or trajectories, are
calculated using computer models in two steps. First, the Met Office numerical weather
prediction (NWP) model produces forecasts of winds and temperatures on
50 altitude levels ranging from the ground to the upper
atmosphere. Their model represents the atmosphere at each level using
a grid which covers the globe (like a series of concentric egg
shells). Every afternoon the latest surface, radiosonde (weather
balloon) and satellite observations are collected from around the
world and assimilated with the model to give their best guess of the
atmospheric state at the previous midday (12GMT). The NWP model is
then run forwards from 12GMT. When finished in the evening, these
meteorological forecasts are transferred to the University of Reading Meteorology
Department and used to calculate the winds to be encountered by
the balloon throughout its journey and the direction in which it would
be blown if launched. Click on the blue `forecast' buttons to see the
predicted path of the balloon for each launch time (the title on each
plot indicates the launch time).
Ten different scenarios of the balloon ascent and descent
rates are used to calculate the ten coloured trajectories in the
forecasts. Since the exact details of the balloon ascent and descent
are not known beforehand, these forecasts give the pilots a good
indication of possible landing sites for the balloon. The six
trajectories reaching the target altitude of 40km give the best
estimates of balloon path. It is essential that the balloon lands in
the sea and a launch would only go ahead if all six trajectories
were forecast to land many kilometres off-shore. The other four
trajectories (blue to indigo) indicate what would happen if the
balloon levels out at different altitudes. The trajectory model was
written by John Methven for the
U.K. Universities Global Atmospheric Modelling Programme (UGAMP),
a national programme conducting fundamental research into atmospheric
science, funded by the Natural
Environment Research Council (NERC).
|
|