The cyclone composites in the atlas highlight the relative positions of cold, warm and occluded fronts and their associated wind and cloud patterns. They also illustrate the evolution of cyclonic flows such as the warm and cold conveyor belt and dry intrusion.
Extratropical cyclones play a significant role in determining the day-to-day weather conditions in many parts of the world through their associated wind and precipitation patterns. Their typical evolution characteristics are therefore of great interest to both educators and researchers of extratropical cyclone dynamics. The structure and evolution of extratropical cyclones, as viewed from the surface, was first described by Bjerknes and Solberg (1922) who developed a conceptual model called the Norwegian cyclone model. Inconsistencies between observations and the Norwegian model have led to refinements of the model and to the development of new conceptual models such as that proposed by Shapiro and Keyser (1990). Detailed analysis of the structure and evolution of individual extratropical cyclones suggest that although there is no universal lifecycle of extratropical cyclones some general cyclone characteristics can be identified (see review paper by Ulbrich et al. (2009) and references therein). For example, Browning and Roberts (1994) described the structural evolution of a moderately intense extratropical cyclone, using a combination of surface observations, satellite imagery, radar data and model output. They identified and described the evolution of cyclonic flows such as the warm and cold conveyor belt flows and the dry intrusion. Such case studies have contributed significantly to the generation of three-dimensional conceptual models of extratropical cyclones that provide a framework for understanding their dynamical evolution. These conceptual models are widely used in educational meteorology courses and texts (e.g. Ahrens, 2000) throughout the world to illustrate the basic structure and evolution of extratropical cyclones.
If you make use of the STORMS Extratropical Cyclone Atlas, please use the following citation: STORMS Extratropical Cyclone Atlas (2011). Data retrieved [Day Month Year] from http://www.met.reading.ac.uk/~storms.
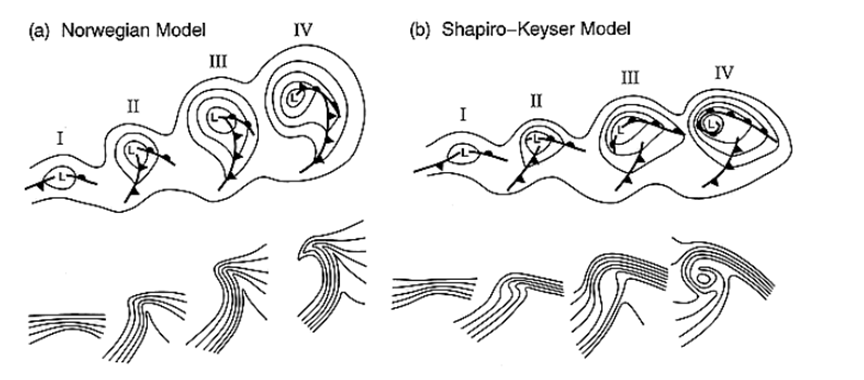
Conceptual models of cyclone evolution showing low-level geopotential height and fronts (top), and low-level potential temperature (bottom). (a) Norwegian cyclone model: (I) incipient frontal cyclone, (II) and (III) narrowing warm sector, (IV) occlusion; (b) Shapiro–Keyser cyclone model: (I) incipient frontal cyclone, (II) frontal fracture, (III) frontal T-bone and bent-back front, (IV) frontal T-bone and warm seclusion. (b) is adapted from Shapiro and Keyser (1990), their FIG. 10.27) to enhance the zonal elongation of the cyclone and fronts and to reflect the continued existence of the frontal T-bone in stage IV. The stages in the respective cyclone evolutions are separated by approximately 6–24 h and the frontal symbols are conventional. The characteristic scale of the cyclones based on the distance from the geopotential height minimum, denoted by L, to the outermost geopotential height contour in stage IV is 1000 km. (This figure and text are taken from Schultz et al. 1998).