Menu
 |
 |
 |
 |
 |
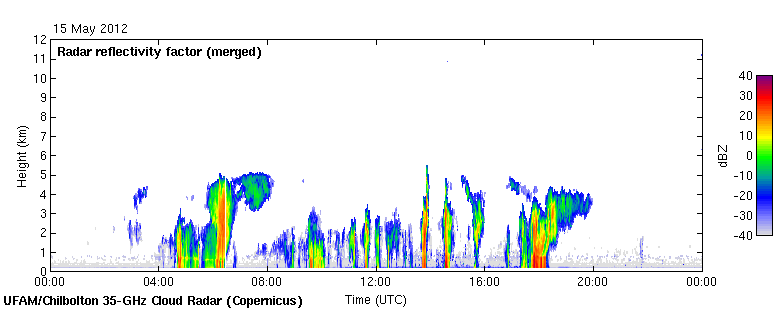
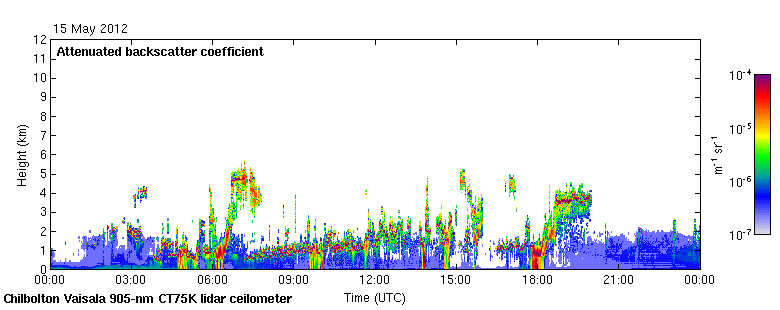
Northerlies bring post-frontal showers, with various waves leading to organisation of convection in NW-SE lines.
See the UKV forecasts starting with the 3Z forecast from the previous day and ending with the 15Z forecast on the current day.
See the 3Z forecasts from the UKV-4km-NAE runs.
See the Chilbolton scans (radar reflectivity, radial velocity, Nimrod rainfall).
See the 3D Volumes (5Z and 20Z isosurfaces from merged Chilbolton PPI scans).
See the Vertical velocities (Derived from sets of four Chilbolton RHI scans following Hogan et al. 2008).
See a quick Statistical comparison between the UKV and Nimrod data for storm evolution in terms of area and mean rainfall.
Tephigrams produced by http://meteocentre.com/.
Red curve: Temperature.
Solid Blue curve: Wet-bulb temperature.
Dashed Blue curve: Dewpoint temperature.
Dashed Magenta curve: trajectory of parcel associated with the CAPE.
Beige curve: US Standard Atmosphere.